IB Science IA Guide
Introduction
Getting the IB Internal Assessment (IA) right will guarantee you at least a passing grade in the IB Program. Using the last IB grade boundaries when conditions were normal (2019), getting 30% in most subjects gives you an IB grade 3 – a grade which many students struggle to attain. You pass automatically without even doing any exams! Getting a good grade on the IA also means that you can mess up on exams, but as long as you have half the points on both exams, you will likely end up with a 7. However, the difficulty in the IA is in how opaque the process of writing it is. This guide aims to show you how to go from start to finish and write an IA worthy of a 7. It’ll mostly be focused on sciences and math, but the stated tips work for all IB subjects with an IA.
I wrote this document because there is rarely any good knowledge on the internet on how to start from scratch and end up with a good IA. Most of those resources are either paid, low-quality, or both. They also refrain from including the spicier tips, which I will not refrain from.
There are, as stated previously, changes in the format of the IA after 2023. I will write the guide given the information I had and learned, as well as having read the subject guides before 2023 in depth. The changes to the IA do not seem to be so big, so I feel pretty confident about the advice I am giving you being still relevant. These are the changes from 2023 from the website of the IB, for physics, chemistry and biology:
The ‘scientific investigation’ (internal assessment) will also see a change, with the opportunity for students to collaborate and support each other within small groups. Where appropriate, students will be able to share similar methodologies, provided that the independent or dependent variable differ, and the data collected is unique to each student.
Students will continue to submit an individual report with a maximum word count of 3,000 words.
The revised criteria will place a greater emphasis on higher-order thinking skills with 50% of the marks allocated for Conclusion and Evaluation.
Personally, on all the IAs I did and got a predicted grade on, I had a 7 with either full marks or one mark missing. I researched a lot on what makes IAs work and how to do well on them, as well as writing some amateur academic research papers in my free time, so I had additional experience from that to add on top of my IA knowledge. Furthermore, I took AP Statistics and did well on the final exam, so I have additional statistical knowledge which is very welcome in an IA. I will show you how all of these things helped me, as well as how you don’t need to spend your teenage years reading about Gaussian distributions and the gamma function to do an IA properly.
What most students miss
First, you must know what the IB IA is. I’ll let Mister Bing (the AI) describe it using his own heartless words (perfect for an IA): IB IA stands for International Baccalaureate Internal Assessment. It is a subject-related assessment that every student needs to submit on a particular topic which is offered by International Baccalaureate (IB). It’s document in which students need to research, experiment and analyze things and explain it in their own words with a related example. The IB IA comprises 20% of the final grade, making it an integral assignment in IB. Most IA papers include graphs, surveys, calculations and need to be around 2,200 words ranging across 12 pages, depending on the subject and the brief given by the instructor. There are two main concepts you need to understand in order to do well on the IA: know your audience and read the fucking manual (RTFM).
Know your audience: the IA is called internal for a reason – your teachers are the ones grading it. Now, they will tell you that it is externally moderated, and that is true. It is random and changes each year in each school, but essentially an IB examiner will randomly select an IA (or maybe multiple) from your class and grade it. Then, the examiner’s grade will be compared to your teacher’s grade. If your teacher graded the IA one grade higher than the examiner, then the examiner assumes that all the other IAs are graded one grade higher than they’re supposed to be, and thus everyone gets their grade lowered. However, it can happen the other way around and your grade can get increased. It’s basically completely random and arbitrary and shouldn’t worry you at all. The main “audience” is still your teacher. Thus, what is most important for each IA is to know what your teacher likes and understands. As long as you’re not too late with your IA submission, your teacher will give you feedback. Even if you think that the feedback is unreasonable, apply it. You’re not grading your IA – your teacher is. Even if you think that your teacher is going against IB guidelines, statistically your IA is much more likely to be graded by your teacher than an actual IB examiner. You’re much better off appeasing your teacher, rather than strictly following IB guidelines even if told to do something contradictory. However, it’s very unlikely that your teachers aren’t following the official IB guidelines, so they should be your primary focus. Usually, the areas where teachers stray from the guidelines are in places where the guidelines are ambiguous, such as whether appendices count towards the soft 12 page limit of the science IA. This brings me to my next main point.
Read the fucking manual: the IB publishes these wonderful documents called “IB Subject Guides”. PDFs of these guides are freely available online with one Google search, just make sure to pick one which is for the current year, since subject descriptions, criteria and protocols change frequently. In each of these documents you can find the exact criteria your teachers and examiners will be using. They’re free, and they’re all you need to know. The criteria are essentially a checklist for what your IA has, and if it fits all the boxes, you get as many points as each criterion gives respectively. Just make sure to scroll down to the bottom of the subject guide, since IA criteria are usually located there. For the most recent edition of the IB Chemistry subject guide, for example, the IA part is located on pages 178-184 of the document. These six pages give you the exact criteria, so make sure to read them. Many students (sometimes even teachers!) don’t know things which are explicitly stated in the subject guide. Make sure to read the subject guide and focus on the more important parts where the grade descriptors are stated. The IB even helpfully bolds relevant keywords for you, it couldn’t be easier than that! As long as you follow these guidelines exactly, it’s impossible to not get a 7, since they tell you everything you need to have in your IA to have a 7.
This is where the two previous points combine. The IB, unlike certain state school systems you might be used to, grades using mostly objective criteria. However, since holistic grading is not very objective, the criteria are very rigid and explicit, because the IB needs to be universal and attempt to grade millions of completely different students with identical standards and attempt to remove the subjective opinions of teachers from the grading. This is also why the external grade moderation exists. Essentially, this means that there is a formula to getting a 7, and as stated initially, if you just follow those steps, you can get a lot of work done without putting in too much effort.
What the IA isn’t
One important thing you need to keep in mind is that the IB knows you’re just a high school student. You’re not expected to produce groundbreaking research, discover something, or change the world. A great former teacher of mine once told me that “in academia, if you don’t have at least one PhD next to your name, your opinion doesn’t and shouldn’t matter”. You’re barely halfway done with high school, you’re expected to have absolutely no idea how research works, and you shouldn’t know yet! The IA is just preparing you for the real world, where it’s likely that you’ll have to eventually write a research paper or report. What’s more important is that you understand the formatting, organization and idea behind doing and presenting research. As you can see from the subject guides, there are no criteria which deal with originality. You can get a 7 even when doing simple experiments, and you probably should. Again, you’re not being tested on your intelligence or knowledge, the IB just wants you to learn how to read and source research, do an experiment (no matter how simple) and then describe and analyze it. The IB subject guide explicitly says that “the task produced should be complex and commensurate with the level of the course.” Complex in this case means more complicated than a classroom demonstration. Don’t underestimate the complexity behind even simple experiments.
Formatting
There is no specific requirement for formatting the IB Science IA. You should ask your teachers if they have specific formatting requirements for their IAs. MLA is a good starting point, but the double spacing can be devastating to your page count. Some general guidelines taken from the internet are:
- Font: Use a professional and clean-looking font, such as Arial if you can, or Times New Roman if you can’t.
- Font Size: The minimum font size should be 11, although 12 may be better for readability.
- Line Spacing: Use single line spacing or greater. A line spacing of 1.5 or double may be better for readability, but make sure to adjust this based on how much space you have, so that you stay under the page limit.
- Page Numbers: Pages should be numbered.
- Page Orientation: The page orientation should be set to portrait, except when necessary or appropriate, such as when you have a really wide graph – but make sure to ask your teacher!
- Document Size and Format: The document size should not exceed 50MB. Generally submit your files as PDF if you can, or DOCX if you can’t. Nothing else.
- Links: Examiners can’t look at embedded links in your document, so don’t add them (embedded means that there is a word which is not the full link but contains your link, like this, but this is fine: https://snikolaj.com/).
How to find your topic
Now that you hopefully understand the idea behind the IA, let’s go through the process of writing an IA, from start to finish. This part is slightly different for all IAs, but I’ll share a simple process through which you can find ideas which is applicable to the sciences. The vast majority of science IAs, as per the subject guide, are simply measuring how X affects Y experimentally. You likely already know (and you should know from the research you will do and formulas you use) the relationship between those two variables, but the IB wants you to test that out. If you don’t know where to start, here are a few simple steps:
- Start with either your book or formula booklet.
- Take an interesting formula or definition where two or more variables interact (an example which is very commonly used in Physics IAs is Ohm’s law – V=I*R).
- Take the name of the formula (or just write the letters out) and Google “[name of formula] experiment” and “[name of formula] proof” and “[name of formula] explained”.
- For Biology or Sports Science, replace formula with “how does [thing] affect [another thing]”, such as (example taken from clastify.com) “Investigating the effect of coffee on the rate of protein digestion”.
- For Chemistry, you can go either way.
- Find an experiment which fits the IB requirement of “measuring how X affects Y” and write down as much information as you can find, make sure to save all the sources you use.
- Do that experiment.
Some tips:
- For fancier sources, use Google Scholar, but make sure you understand what you’re testing – remember, no extra points for being smart.
- Make sure the idea is simple but the experiment is not very simple, this will help out tremendously with error analysis while making your Process section not too short.
- Don’t be afraid to look at other people’s IAs – there are only so many experiments which high schoolers can do, and as long as you don’t copy the content and process directly, it’s fine to take inspiration.
- Find an experiment that’s exactly like yours so that you can see how the results should look like, and you can cite and compare it – it’s even essential to compare your findings to the accepted scientific context.
- Make sure your formula and experiment matter (are applicable and have a real-world impact), because describing and evaluating the real-world context, history of the topic and current scientific data is essential in all IAs, regardless of subject.
It’s important to again note that this is mostly for sciences, because there I have the most experience, but this general process applies for all IAs. Find something someone more educated than you has done, and do it in an IB style, then compare your results and why they matter. Before going into the criteria and how to score well on them, it’s important to first outline how IB assessments are graded.
In your IA you should cite each source that you use in its respective section in the MLA format. You probably learned this in your classes, but you likely want to use Citation Machine. You can also learn how to do this in Google Docs or Microsoft Word, which will help you in the future if you’ll be writing real research papers where you’ll have to organize many more citations. The sources don’t have to be extremely high quality peer reviewed papers, you can also use some regular online articles, but make sure that the source is at least somewhat legitimate.
Important fact about IB grading and how to use it to your advantage
Place yourself in the position of your teacher or an IB examiner. If you’re in a school that forces teachers to have multiple IB classes with 20 students each, you’re likely to have 40-60 IAs submitted, and you have only a couple of weeks to review all of them, give feedback, then finally grade them. Then, you must grade carefully, knowing that one mistake could mean all of your students get their grades lowered and you get a warning by the IB. Also, you’re not getting paid extra for this. What all teachers do (and I’ve asked many) is simply skim the IAs they are given, looking for keywords or obvious mistakes. This isn’t just for IAs – this is for any assessment where you have to write many words, and the IB itself encourages this. If you look at the science paper 2, where definitions are asked, the official markscheme usually requires only one specific keyword to be present for each mark of the question. If you don’t have those words, even for questions which might be half a page long, you’re not getting any marks. Most teachers spend only a couple of minutes for each IA, so in reality most of your words aren’t going to be read.
However, this is very advantageous to the student which has the subject guide and knows those magic words. In particular, I want to point you towards one psychological phenomenon which tremendously helps with IB assessments and even life in general. It’s called anchoring bias, and you’ll learn it if you take IB Psychology. Again, letting Mister Bing define our terms gives us: Anchoring bias is a cognitive bias that causes people to rely too heavily on the first piece of information they receive when making decisions. This information is called an anchor and it can be numerical, visual or verbal. Once an anchor is set, people tend to make adjustments based on that anchor, even if it’s irrelevant or incorrect. Anchoring bias can lead to poor decision-making because it can cause people to ignore other relevant information.
You can use this bias to incredible success for every single IB assessment. To be effective, you’ll also need to know one essential rule of advertising – and in IB and the professional world you’re basically advertising yourself constantly. It’s the rule of three, or professionally called effective frequency. It’s simple – to successfully advertise something, you need to expose your audience to it at least three times. You can drastically improve your chances of getting a good mark in each criterion by simply going to the subject guide, looking the bolded words (and other important ones you find) for the top markband and using them three times in your assessment in appropriate places. I will point these appropriate words out for each criterion as we go forward.
Another note for this is to strive to make your IA look nice. Humans generally treat things that look nice (people, animals, documents) better, and you can get away with more mistakes if you put in the extra effort to make your photos, tables and diagrams look better. If you don’t have a mandatory font, try to find one that you like. My favorites are Ubuntu and Red Hat Text. For photos, you generally want to annotate them and for this there are many online annotation tools. This tip is also good for decreasing your word count and increasing the density of information, as you can make visual parts contain text too. However, for all of this, make sure to stay within the margins of the restrictions you’re given. If you’ve cut everything you want to cut, and still can’t fit it all – reduce font size, use Times New Roman (which is a very compact font), reduce spacing – content and volume should be your priority.
There’s no IA without I
One aspect which is relevant to all IB assessments, but particularly the IA, is the question – why does this matter? What are the consequences of this knowledge? Why are you researching and exploring this? The IA in most subjects contains some criterion that grades your personal interest and the relevance of the research, which are related. Your IA should be something that you’re interested in and want to research – that’s both seen positively by the IB and is something that should motivate you to continue writing your IA. Your motivation can be as simple as having been curious what one of your parents does for work, or being interested in chemical water purification, or how plants react to the presence of chemicals in the environment. As stated above, it doesn’t have to be special, it just has to be there and be logical in the context of your exploration.
Personal engagement as a criterion isn’t worth many points, but even the points you get are basically free and easy to obtain as long as you can read the criteria. It’s also good for yourself if you believe that what you’re researching is actually useful. Some students make such good IAs that they can even slightly modify them to make actual research papers, so recognize that this can help you down the road.
To get these free points, you can just say “my personal motivation for exploring X is…” and “this research is relevant because…” and then state good reasons. Of course, the IB like things that focus on actual social issues, even though it’s not explicitly stated in the subject guide. If you’ve been interested in how the wavelength of light affects the rate of photosynthesis, and you want to find out which artificial light is most power efficient (to reduce your carbon footprint) and your local community has farmers which you can collaborate with, you’ve got a convincing story and you’re genuinely researching something important.
Just a quick note – nobody will actually verify that your dad works at a company which does sustainable cheese production and you want to compare protein content in different animal milk using vinegar, avoiding the use of expensive and artificial chemicals. However, don’t get too involved in trying to make a story, and you’re more likely to not be as interested in the topic if you try to make up the reasons for why you’re interested. Just try to avoid lying.
General writing tips
It’s easier and much better to remove than to add. I wrote my IA with a simple two-phase process:
- Write absolutely everything about all the parts of your IA. Make your introduction have too much information, make your descriptions excessively long, make your reflection a whole IA by itself. Once you have this, you can send it for feedback to your teacher(s) and friends. You will get the comment that there is too much information, but even more important are the specific areas that are too much. Remember that your feedback round is a preliminary grade, and generally too much is graded less strictly than too little. Too much is also good because your teacher already gets the impression that you know what you’re talking about.
- Remove absolutely everything that you don’t need. There are endless pages of writing tips for removing what you don’t need, and if you want to write professionally, knowing what to remove is more important than knowing what to write at first. Because there are endless pages, I asked Bestie Bing to write them here:
- Use simple words: Use simple words instead of complicated-sounding phrases. For example, replace “a majority of” with “most”.
- Eliminate unnecessary words: Eliminate unnecessary words and phrases. For example, replace “in my opinion” with “I think”.
- Use active voice: Use active voice instead of passive voice. For example, replace “the ball was thrown by John” with “John threw the ball”.
- Break up long sentences: Long sentences can be difficult to follow. Break them up into shorter sentences.
- Use prepositions instead of adverbs: Use prepositions instead of adverbs to describe actions in more detail.
- Use coordinating conjunctions: Use coordinating conjunctions such as “and”, “but”, “or”, and “nor” to eliminate unnecessary commas and make your writing flow better.
- Avoid inflated phrases: Avoid using phrases that use several words where just one or two would be sufficient. For example, replace “a sufficient amount/number of” with “enough”.
- Avoid redundancies: Avoid using redundant words and phrases. For example, replace “added bonus” with “bonus”.
All of these above are common mistakes that students make – and it’s not their fault. Schools love to show you examples of inflated writers which use a dictionary as a replacement for creativity and originality.
What to write it on and which sites to use
This is a surprisingly important question which will affect you in the future if you’re planning to pursue anything remotely academic. Personally, I’d strongly recommend using Google Docs for writing all your IAs for multiple reasons:
- Excellent integration with Google Sheets, where you can import any experimental data that you have. You can create graphs, plots and tables on Google Sheets and have them directly placed in your Google Docs IA document. This way, if you change any of your graphs, plots and tables, those changes will be automatically synchronized with your IA document.
- Google Docs is very simple and intuitive, even if you’re not familiar with professional text editors. Even though Microsoft Word is more powerful, it is also harder to learn to the same level of Google Docs. For now, you don’t need that much power.
- Google Docs easily allows others to view and comment your document, which is excellent for collaboration, especially when your classmates/school are also in on the whole Google thing. I’d recommend having your friends (who’ve studied or are currently studying the exact same material!) review your IAs and leave comments. Tell them to be as honest and pedantic as possible.
- Google Docs and the whole Google Suite is free and online, so you can access your work from any device anywhere with an internet connection. This also gives you no excuse to not have your document wherever you are. Personally, I’ve done a lot of my work for some IAs on my phone on the bus going home. This also means that if something happens to your device, your document isn’t lost. However, since being online has its own risks, also make sure to keep a local copy of all your important documents. I had a large USB always on me with a complete copy of my school Google Drive. Generally, real archivists recommend at least 3 completely different storage media if you want to truly keep your files safe, but 2 will suffice given Google’s decent security.
- Google Docs keeps a log of all edits, who did them and when they did them on a document. This means that you can keep track of your progress, possibly go back to earlier versions, and more effectively collaborate with others. This is both important for IAs and for general projects with others (such as group work).
The IA introduction
Your IA introduction has four purposes – it should introduce the topic, it should introduce the current scientific consensus, it should introduce your research question and it should introduce your motivation for why you selected your topic. For mathematics and science, make sure your introduction is approximately two to three whole pages long (single spaced, 12pt font). Here is where the main part of your personal engagement should be stated. For introducing the topic, try to have at least two scientific sources as well as one to three images or drawings which illustrate your topic. For each image or drawing (labeled Figure with a number after it, you can make Google Docs/Microsoft Word add this automatically), make sure to reference it in the text – it needs to be there for a reason. Remember, when teachers and examiners skim through your IA, they won’t read the words, but they’ll see a figure and text referencing that figure, and they’ll see external citations, which illustrates to them that you’re smart enough to construct an argument and back it up with visual and textual evidence. Remember to explicitly state that “this is relevant because…” and other statements based on your subject guide which tell the teacher what you’re actually doing. It will sound formulaic, but it’s essential. For example, for the History IA you literally need to follow a formula for your first section – you can choose not to, and it will sound “better”, but you will lose points for no reason other than your own stubbornness.
The background information you write should be sourced from your own knowledge, the knowledge in your textbook, as well as external sources. It should be factual knowledge, and it’s assumed that your audience will be your classmates. Thus, choose a topic that your classmates don’t currently understand, but can understand with two pages of information and the knowledge they currently have from class. Make sure to weave in the reasons why the topic is important into your background information. The approximate ratio, from my IAs and many others I’ve read online is five sentences of background information for each two sentences of discussing the importance and one sentence of discussing your own personal motivation.
Here you should also introduce the formulas and methods you will be using, but only giving them a brief overview. There is a whole section for your method, here you should just describe what you’re doing, why you’re doing it, and how you will calculate your results. You should also include a prediction and define what success will look like. For example, plants like red and blue light the most for photosynthesis. Define that you expect blue and red light to result in the highest rate of photosynthesis! Remember the rule of three – explicitly write “the prediction is that…” For some subjects, you also need to write null and alternate hypotheses, and those have a very specific way of writing which your teacher should tell you. If not, just Google “AP Statistics hypothesis testing”. You will learn more statistics from one AP Statistics lesson than the entire IB math course.
At the end of your introduction you also need to write your research question. Make sure to also include a subheading which states that this is indeed your research question. For my first IA draft of one science subject, I didn’t think this was necessary, and omitted the subheading. A teacher later asked me, after the teacher reviewed my IA, where my research question was. It was right there all along, but it wasn’t obvious enough when skimming through. An IB examiner would have marked that IA negatively for not having a research question, when it just wasn’t that obvious! On the topic of subheadings, you probably should have many subheadings which directly guide your teacher what you’re currently talking about. This can only help you and the teacher as no relevant part of your IA will be missed, and you will get extra points for organization.
Writing the research question itself is where many students also make mistakes which aren’t stated anywhere, but are graded negatively nonetheless. For sciences, your research question should be of the format “how does [changing X affect the [measurable variable] of Y through [details of experiment]”. Variations exist, but this is simply the general idea of the IA – you change an independent variable, and measure the resulting change in the dependent variable. This leads us perfectly to the next section.
Describing your variables
Whether it’s Chemistry or Psychology, you will be measuring something with your IA. In this capitalist world, we are all obsessed with having a nice number or equation which can summarize a complex situation. So make sure to seize the opportunity to give a simple answer to a complex question. For science IAs, you need to have an independent variable, a dependent variable and control variables. Ideally, your independent and dependent variables should be in separate subheadings, while the control variables are either in a bulleted list or table.
It’s extremely important to describe the variables, how they will be measured, their unit of measurement and how uncertainties will be taken into account. Usually, your independent and control variables have a constant uncertainty based on the measurement equipment you’re using. Mention that. For the control variables, have a table which states each control variable, the value of the control variable, the uncertainty (if applicable), how it is controlled and what would happen if it went out of control – how would the result change?
For the units of all variables, try to have them be SI units. One common “mistake” (not necessarily) is using milliliters and liters instead of centimeters cubed and decimeters cubed. Some teachers and examiners are lenient, many aren’t. You can avoid overly small or large units by using scientific notation – this also makes your IA look fancier.
You should know the uncertainties for all your measurements. For “analog” instruments such as graduated cylinders or analog multimeters, you get the uncertainty by taking the smallest unit of measurement, halving it and adding a ± in front of it. Digital measurement equipment often has an online datasheet where the manufacturer states the uncertainty for you. Make sure to mention where the uncertainty comes from, it shows that you know your equipment.
Anything that can be measured and affects your experiment is a variable. You can also state that a control variable has a negligible effect and can be ignored, anything is fine as long as it’s justified. The relevance and nature of control variables depends heavily on the experiment you’re doing. In Chemistry, for example, heat is always a very important factor. If you’re doing photosynthesis with custom lights – how do you minimize the influence of external light on your experiment? If you’re using a formula, what are the other variables in the formula? As I said, anything can be mentioned as long as you justify why it’s there.
Describing your equipment and experimental setup
You’re probably going to be using some measurement tools and setting up your equipment in some way. Make sure to document and take pictures of what you do and how you do it. Often, noting down the exact model of the equipment you’re using (if known) is a good way to get some extra points, and in the research world it’s also a nice habit to have. Also, it shows some extra interest and knowing the equipment’s model means you can find out the uncertainties. If possible, try to use the Vernier equipment in school and the multimeters. Vernier equipment is accepted as the gold standard for simpler experiments. If you’re using dishes or graduated cylinders, what are their dimensions?
For the chemicals or seeds or whatever you’re using, it’s also helpful to mention where they were obtained from and their quantity. Chemicals have a concentration and may have an uncertainty for that concentration. Concentrations are usually given by mass, so if you’re using 1L of 9% ethanoic acid, then assume that it’s 1kg and naturally 90g of that will be ethanoic acid. For chemicals, mention their physical state and quantity. For everything else, include as much details as is relevant to the experiment.
Safety
Safety is essential in all of the sciences, so make sure you have a section discussing it. The IB wants you to discuss your safety, ethical and environmental precautions. You must discuss all three, even when it may not be applicable.
For safety precautions, you should be wearing a lab coat, gloves and goggles in Chemistry, and mention a protocol you have for handling chemical spills or glassware breakage. Similarly for Biology, you should try to not handle any bacteria or biological material with your bare hands, and mention similar protocols for handling accidents. For physics, this depends on your experiment. If there are no safety risks, mention that and justify it.
For ethical precautions, only mention the steps you’re taking if you include animals (or humans) in your experiment. The IB has pretty strict guidelines on working with animals, and especially with humans. A consent form is likely needed if working with humans in Biology, though I haven’t seen many such experiments. This is more relevant for IB Biology and Psychology. If ethical precautions are unnecessary, mention that and mention why – “since no humans/animals were involved in this experiment…”
For environmental precautions, discuss how your experiment might affect the environment and what you’ll do to mitigate and eliminate any hazards. This is mostly applicable to Chemistry, where chemicals need to be disposed of safely for specific reasons. To find out if the chemicals you have need any special precautions, just use Google and look up “[chemical] material safety data sheet”. If you’re going to reuse the equipment after an experiment – mention it! If you’re going to throw it away or dispose it in a safe way – mention it!
Method
The method should preferably be described as a sequence of numbered steps. You want someone to be able to follow each step without knowing the subject and still be able to accomplish the experiment. Ideally you’d want short and descriptive numbered statements as in the following example:
- Connect power supply clips to the two electrodes
- Place the two electrodes in water, diagonally separated
- Adjust the power supply knob to 10V
- Turn on the power supply
You should include pictures if necessary, or if a step can’t easily be described using words. You should also include a picture (or preferably a very well drawn diagram) of the entire experimental setup, both to show what the final result (or an important step) should look like and to show that you’ve actually done the experiment. Make sure that all of the equipment in this picture or diagram is labeled! If there are any steps that should be repeated, you can simply state “Repeat steps p to q r times” (p, q, r ℕ).
There is no complex formula for the method and this should be something you score easy points on. Make sure that you mention no new information in the method that wasn’t described in the introduction, equipment and experimental setup.
You should have multiple trials – discuss with your teacher for exactly how many. Generally, 5 to 10 should be enough, but this can vary depending on your experiment’s difficulty, uncertainties and material cost/availability. You can get away with more or less. More trials will increase the accuracy of your result, but will also mean that you have to do more work, which for some experiments (particularly in chemistry) isn’t always feasible.
Data
This is also a section which is a bunch of easy points if you follow a few essential steps. As opposed to what you may be used to, the data section in science IAs is very specific – you need to include both quantitative and qualitative data. This is actually good practice for when you’ll be doing real science, since you’ll usually be including both in real scientific writing.
Qualitative
The qualitative data section is the easier one since you just have to write the sensory observations you had during the experiment. If you were doing a chemistry experiment, did the reaction make any sounds? Did the flask you were using get warmer or colder? If you were doing a physics experiment with electricity, were there any sparks or light? Make sure to only include these if they follow these rough guidelines:
- You mentioned in a previous section that the experiment is supposed to make some sound, some light, some heat or some other thing you can sense yourself – you should interpret this later.
- Something unexpected happened (like sparks came out or there was smoke) which might have influenced the final result – you should interpret this later.
- A reaction indicator was stronger or weaker than expected – you should interpret this later.
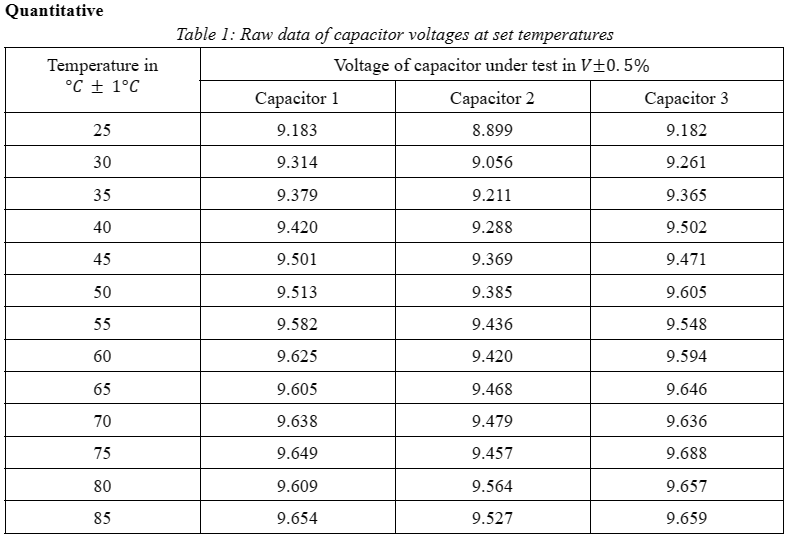
Quantitative
This section should contain tables (or some other form of data organization if applicable) where you only state the raw data that you received. No interpretation or evaluation should be done here – that comes afterwards. The formatting of the tables is important and you should take particular care to fulfill all of these necessary criteria (an example will be included below):
- Include a caption above the table where you state its number and very briefly describe what data it contains.
- Include table headings where you state the variables being measured, the unit you’ll measure them in and the uncertainty of that measurement. Make sure that everything you include here has been described in your equipment, experimental setup and method. This should follow the specific format “<variable being measured> in <measurement unit> ±5 <measurement unit>”.
- If you have multiple measurements (which you should) then have them all in separate columns with a grouped row above them acting as a grouped table heading (see example below).
- Include the independent variable on the left and the dependent variable on the right.
- You must make sure that the number of significant figures is constant for all measurements and numbers afterwards. You should’ve learned how to do this in your previous classes, but generally for raw data your number of significant figures should be as much as the precision of your measurement tools, but without going crazy with extremely accurate measurements. Generally, three significant figures is enough for the raw data if your instrument can handle that many. Make sure to include leading zeros if your number is more round (for example, 0.9 with three significant figures would be 0.900).
Example from an IA which scored a 7:
You should also introduce your uncertainty formulas here for the final calculations. You must include how you got the formulas, possibly comment something about them if you have something to comment and you must do this for all variables you use in your calculations. If you’re calculating something more complex, you can use the site https://uncertaintycalculator.com to have your uncertainties calculated for you. However, this site uses more complex and more accurate uncertainty calculations which use standard deviations and partial derivatives. Luckily, you can just use a calculator and input the function you get out of the website.
Data analysis
Right after you show the raw data and the uncertainty calculations, you should proceed with data analysis. First, make sure to include the uncertainty of your final tested variable’s formula in a table similar to the one you made above. This should look like the following example:

Data analysis and interpretation
Here you should apply some kind of statistical test on your data. You’ll generally want a linear regression, however if you graph your data and it doesn’t look linear, (or obviously isn’t linear given the formula you calculated it with) you can use another regression method like quadratic or exponential regression. However, since you’ll want a linear graph in the end, you’ll need to linearize it afterwards. This is relatively easy – if you have a quadratic regression, then take the square root of the results. If you have an exponential regression, take the natural logarithm. In specific cases, like when your exponential regression returns negative numbers, you might also want to do a negative adjustment. Research it if you have to do it, it’s not a hard process and will guarantee you cool points.
In the end, you want a line of best fit. Since the process for this varies depending on your subject, you will want to either consult with your teacher or with the internet. Don’t do any silly mistakes like forcing your line of best fit to pass through the origin. If you do regression, include the regression functions you obtained and their coefficient of determination R2 in your analysis and interpret them both.
The graphs are also pretty specific. You want to include:
- Visible error bars based on the absolute uncertainties you obtained in the previous section. Please look up a guide for how to do this in Microsoft Excel or LibreOffice Calc (the simpler and free alternative to Excel). Note that if you did a quadratic or exponential adjustment to your graph, you have to apply the same formulas to the error bars, or else you’ll get very weird results.
- Logical horizontal and vertical steps. Your graph doesn’t have to start from zero, most of the graph area should be occupied with results, so make sure to dimension it properly to include all of the results. A good way to do this is to take the numerical difference in your independent variable and go down by one and up by one to make your graph’s horizontal minimum and maximum. For the vertical axis, choose something sensible so that most of your results are visible and are not squished or stretched.
- Make sure to include the variable, the unit and optionally the transformation in your axis titles.
- Your graph should have a title that simply follows the format “<dependent variable> over <independent variable>.
- Below your graph you should have a “Figure n” with the number of the figure as well as a short description similar to the one in the sentence above.
- A legend on the side to show what all the lines, dots, circles or whatever you use mean. It’s nice to include colors and different shapes so that the graph isn’t too cluttered and hard to read.
- Minimum and maximum slope lines. These are a weird IB quirk and may be unnecessary (ask your teacher), but they’re just two lines which you can calculate like this:
- Take the first result and its lower boundary uncertainty, and take the last result and its upper boundary uncertainty.
- Calculate the function that connects these two points (simple slope calculation).
- Do the same for the first result and its upper boundary uncertainty with the last result’s lower boundary uncertainty.
- Add these lines (as less prominent, maybe dashed lines) to your graph.
Then, once you have this graph, interpret it in one or two paragraphs. First, state what the graph shows – is there a linear, exponential, quadratic relationship? Mention what you can find out from the graph, but also mention its limitations. Discuss the error bars and what they mean, are they relatively large or small? Do they get bigger or smaller? It’s also important to mention whether all error bars intersect the line of best fit. If they don’t, then you have an outlier or a few. Discuss what would make that result? Just discuss whatever is relevant and comes to mind about the information the graph tells you.
Conclusion
Unfortunately, I can’t say much about this section anymore since there are significant changes to it in the IB after 2023. Generally, you should talk about the results and whether they confirm your initial hypothesis/hypotheses. Discuss your research compared to what others in the field doing the same/similar experiments have discovered. Relate the qualitative and quantitative data to come to a more nuanced conclusion. Ask your teacher for the other changes.
You also want to discuss the strengths and weaknesses of your experiment. What do you think you did right? Does the data support this? Were your uncertainties low or high, were your coefficients of regression above a certain level, did random or systematic errors affect your experiment?
For each strength and weakness, state explicitly how it impacted the final results and by how much. If it’s a weakness, discuss how you could improve it and what the improvement would fix. Then, discuss whether that improvement is feasible on your scale or skill level.
Works cited
You generally should have used other research while writing your IA. The Works cited page is the easiest page to get right, there are only a few things you need to keep in mind:
- Page Placement: The Works Cited page should be a separate page at the end of your research paper.
- Margins and Header: It should have the same one-inch margins and last name, page number header as the rest of your paper.
- Title: The page should be labeled “Works Cited” (do not italicize the words Works Cited or put them in quotation marks) and center the words Works Cited at the top of the page.
- Alignment: The citation entries themselves should be aligned with the left margin.
- Spacing: Double space all citations, but do not skip spaces between entries.
- Indentation: Indent the second and subsequent lines of citations by 0.5 inches to create a hanging indent.
- Online Sources: For online sources, you should include a location to show readers where you found the source. Many scholarly databases use a DOI (digital object identifier). Use a DOI in your citation if you can; otherwise use a URL.
- Order: Alphabetize the entries by the author’s last name.
- End of Entries: All works cited entries end with a period.
That’s all from me, so good luck with writing your IA! Or, pay me to write one for you.